Wetland water balance#
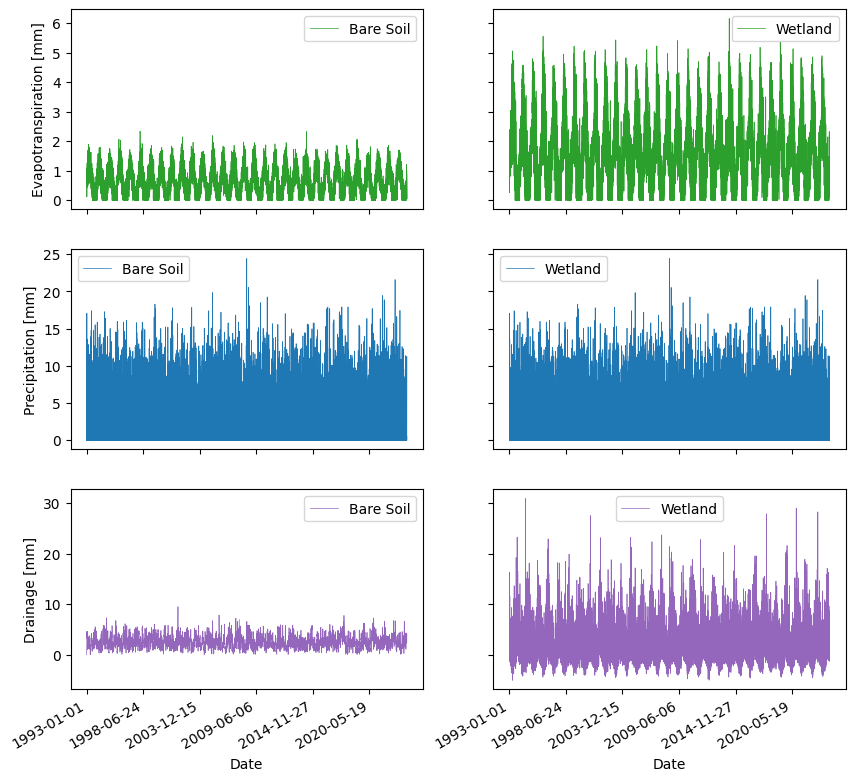
In this example we compare the water balances of a bare soil and a wetland, to estimate the effect of wetland vegatation on groundwater recharge.
Data can be downloaded from SteenChr/edcrop and saved in a working directory.
The working directory
wdircan then be specified in the code block below.
from edcrop import edcrop
import os
import pandas as pd
import matplotlib.pyplot as plt
import warnings
warnings.simplefilter(action='ignore', category=FutureWarning)

wdir = os.path.join(os.path.dirname(os.getcwd()))

os.chdir(os.path.join(wdir, 'data/wetland/'))

yaml = 'edcrop.yaml'

edcrop.run_model(yaml=yaml)
---------------------------------------------------------------------------
ModuleNotFoundError                       Traceback (most recent call last)
Cell In[1], line 1
----> 1 from edcrop import edcrop
      2 import os
      3 import pandas as pd

ModuleNotFoundError: No module named 'edcrop'
df = pd.read_csv('Station1_JB1_BS_ed_wb.out')
df.columns = df.columns.str.replace(' ', '')

df2 = pd.read_csv('Station1_JB1_WL_ed_wb.out')
df2.columns = df2.columns.str.replace(' ', '')

fig, axs = plt.subplots(3,2, sharex = 'col', sharey='row', figsize=(10,10))

df.plot.line(x='Date', y='Ea', ax=axs[0,0], c='C2', label='Bare Soil', lw=0.5)
df2.plot.line(x='Date', y='Ea', ax=axs[0,1], c='C2', label='Wetland', lw=0.5)
df.plot.line(x='Date', y='P', ax=axs[1,0], c='C0', label='Bare Soil', lw=0.5)
df2.plot.line(x='Date', y='P', ax=axs[1,1], c='C0', label='Wetland', lw=0.5)
df.plot.line(x='Date', y='Dsum', ax=axs[2,0], c='C4', label='Bare Soil', lw=0.5)
df2.plot.line(x='Date', y='Dsum', ax=axs[2,1], c='C4', label='Wetland', lw=0.5)

axs[0,0].set_ylabel('Evapotranspiration [mm]')
axs[1,0].set_ylabel('Precipitation [mm]')
axs[2,0].set_ylabel('Drainage [mm]')

fig.autofmt_xdate()